
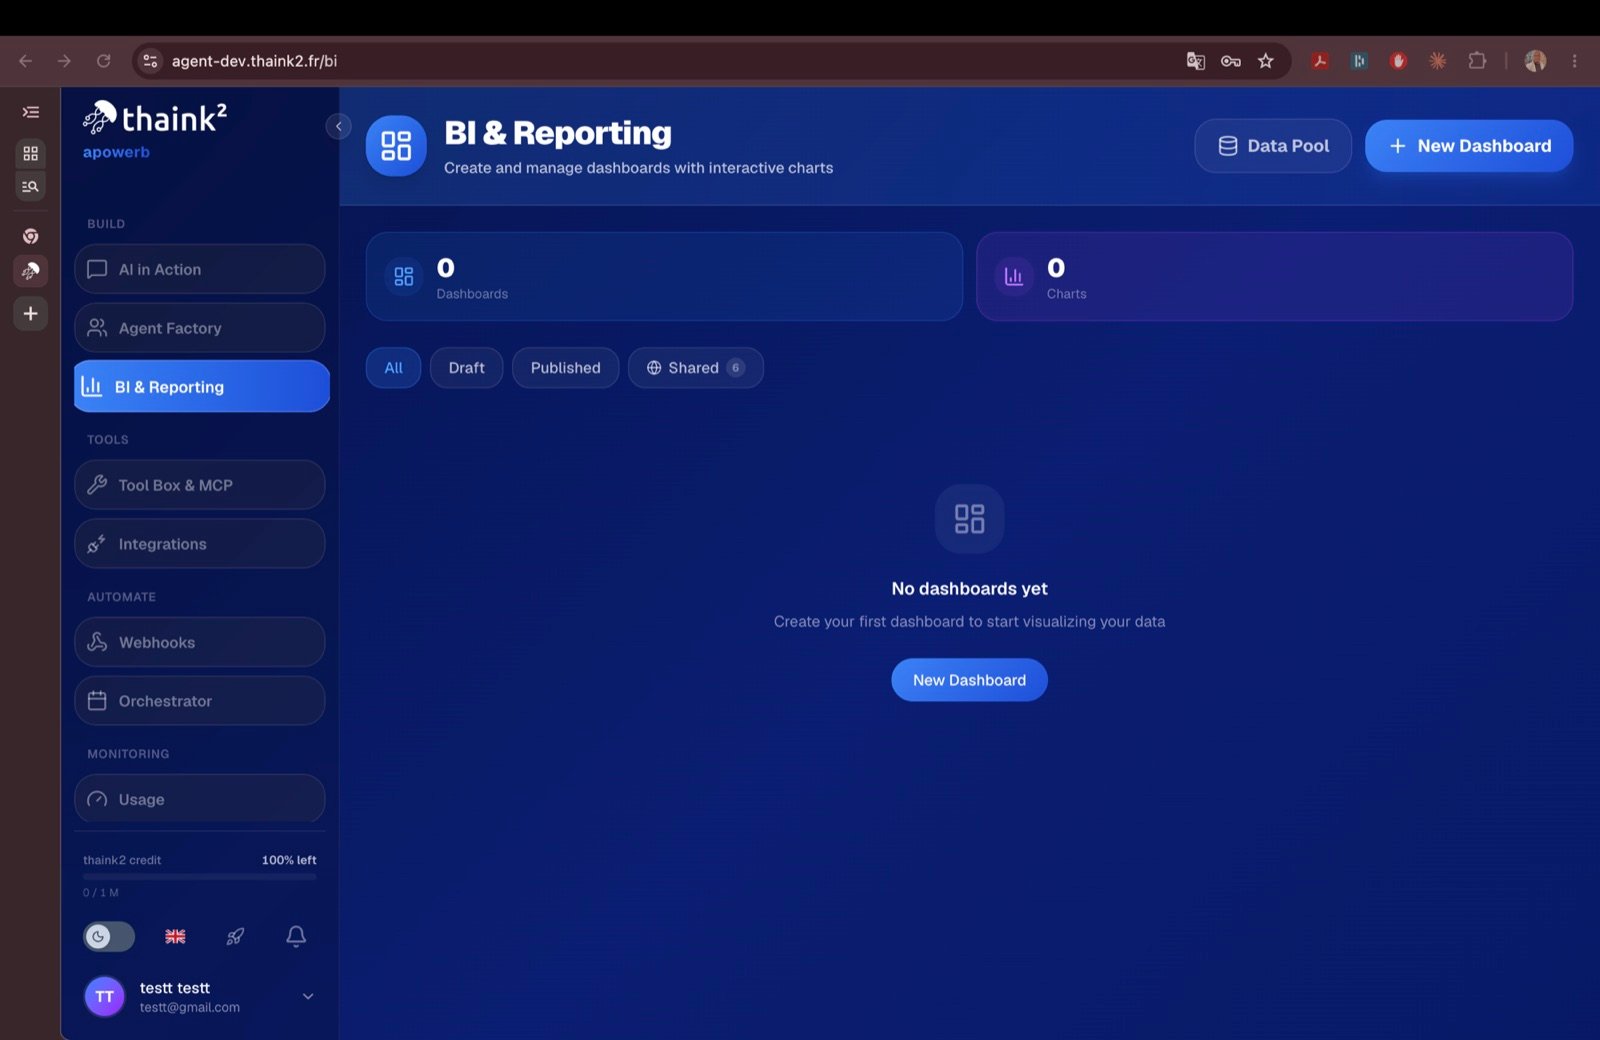
The BI screen: dashboards and charts, filtered by draft, published or shared.
Bringing data in
GET /api/v1/bi/datasets lists what is loaded, /{file_id}/preview shows the first rows
before you build anything on it, and DELETE /{file_id} removes it.
The spreadsheet and Drive paths need the matching
integration connected first.
Charts
Two shortcuts skip the full chart definition for the common cases:
POST /api/v1/charts/{chart_id}/send-to-dashboard pushes a chart onto the caller’s chat
dashboard — it is meant to be triggered by the user, not by an agent acting alone.
A chart whose data comes from an agent
A chart can takesource_type: "agent", in which case its rows are whatever the agent
answers. That answer has to be a JSON array of objects — one object per row — and nothing
else. Two fields in source.source_options drive it:
message, the agent is only asked for the latest data with no indication of
which data, and a capable agent answers with a question or an explanation rather than
rows. GET /api/v1/charts/{chart_id}/data then returns 502, and the message names the
agent and points back at this field. In the interface, the instruction is the What should
the agent return? box, next to the agent picker when you create the chart and in the edit
panel afterwards.
Reasoning is never mistaken for the answer: a model that emits a thinking summary
alongside its reply has that summary discarded, and only the reply is read as data.
Dashboards
A dashboard is a grid of components. Charts are the usual ones, but a component can also hold a key-value block whose content is updated in place.Publishing and sharing
Letting an agent refresh the figures
A dashboard can be linked to an agent, which then becomes responsible for recomputing it.ORCHESTRATOR setting as every other recurring run.
GET /api/v1/bi/stats returns the module’s counters — what the screen above displays.